2 In 1 Data Charts PowerPoint Presentation Template Bundle – Updated 2018 – 2019
These hand-crafted charts are great to make your quantifiable information easy to visualize and to strengthen your overall message. Just pick the one that is right for your audience! Communicate your information clearly and effectively with these beautiful data charts templates for PowerPoint.
All the charts provided in this PPTX document are “data-driven“, i.e. the graphics are generated automatically. They are very easy to edit via Excel under PowerPoint and to (quickly) customize with your own data.
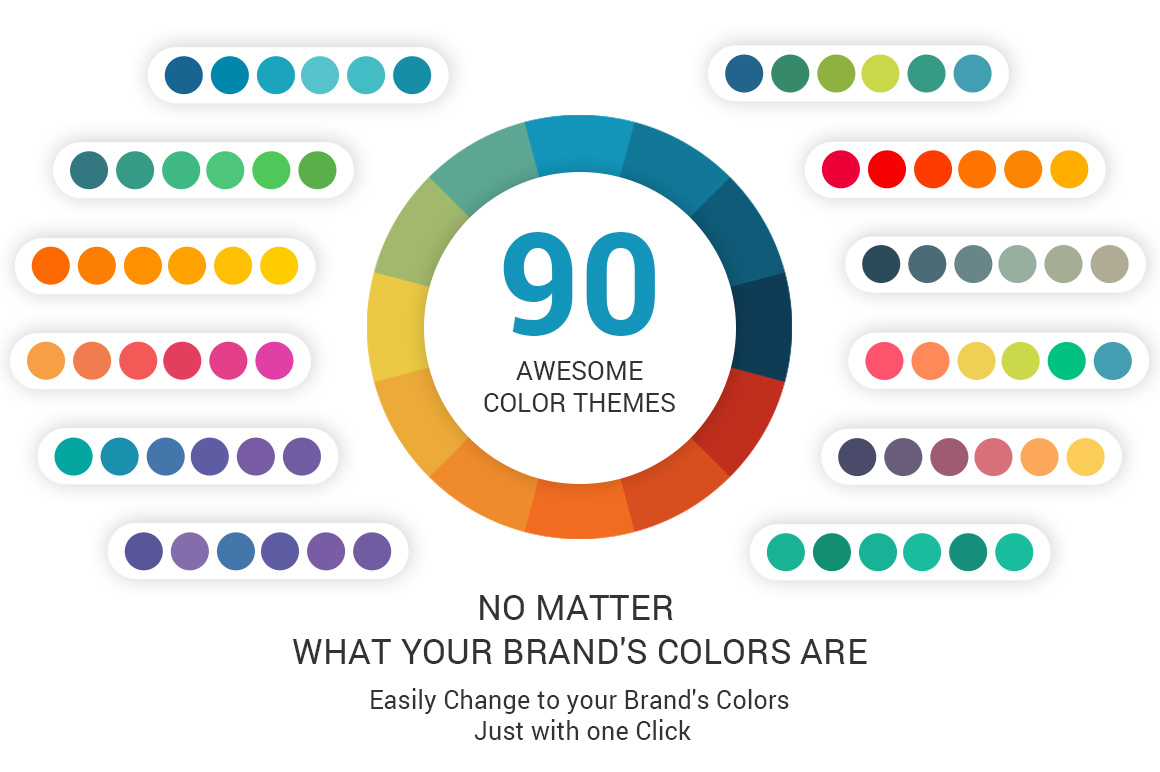
Get it now! Data Charts Bundle 2 PowerPoint Presentation Template, Flexible, clean, creative, simple, unique, scalable PowerPoint Template. All element easy to edit and you can easily change the color to match it with your personal or company brand, Save your time with 90+ Premade colors Themes which you just can with One Click change the colors of all shapes, Icons, fonts and auto recolored .or you can make your own colors theme and apply it on all slides at once. Data Charts Bundle has 116 unique slides of content.
Template content: Column charts, Line charts, Pie and doughnut charts, Bar charts, Area charts, XY (scatter) and bubble charts, Stock charts, Surface charts, Radar charts, Combo charts.
Main Package Folder Contains 2 Professional PowerPoint Templates
Key Features:
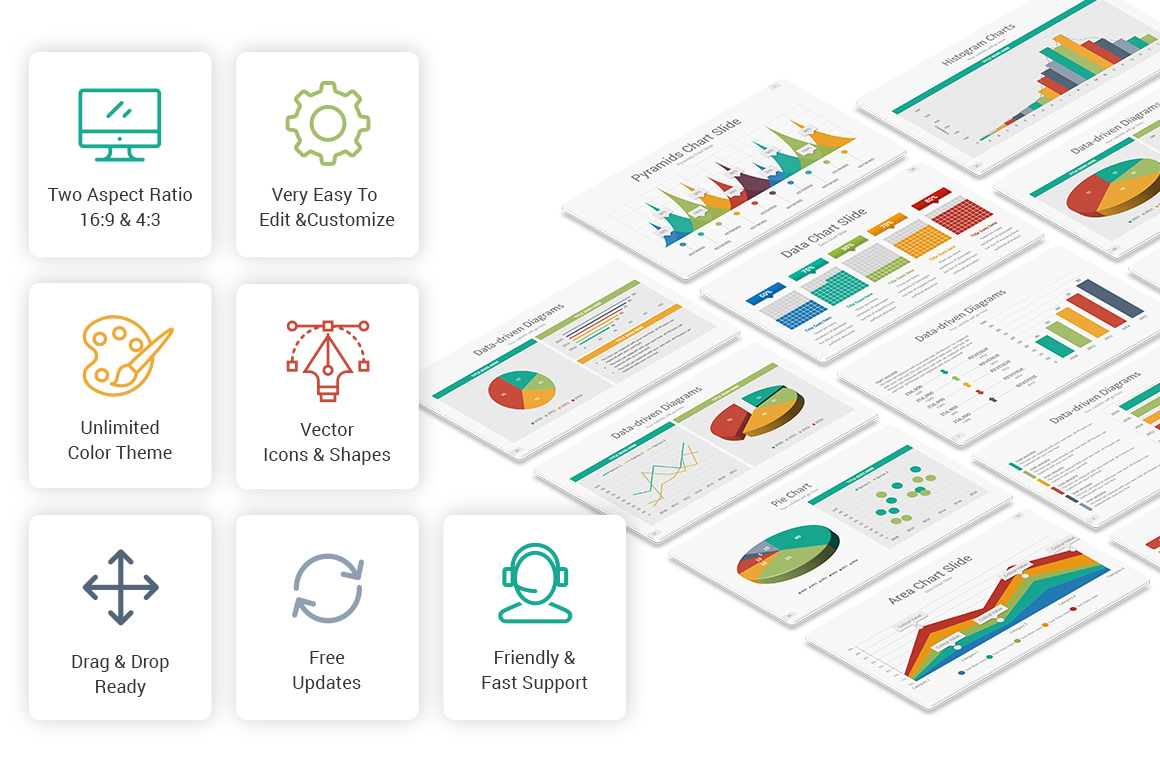
- 116 Flexible, Clean, Simple, & Creative slides
- 2 Aspect Ratio (4:3 & 16:9 )
- 13 Premade templates, 90 Theme colors
- Just One Click for change the colors and auto recolored
- Free Fonts and Icons
- Fully and Easily editable content
- Custom animation for each object
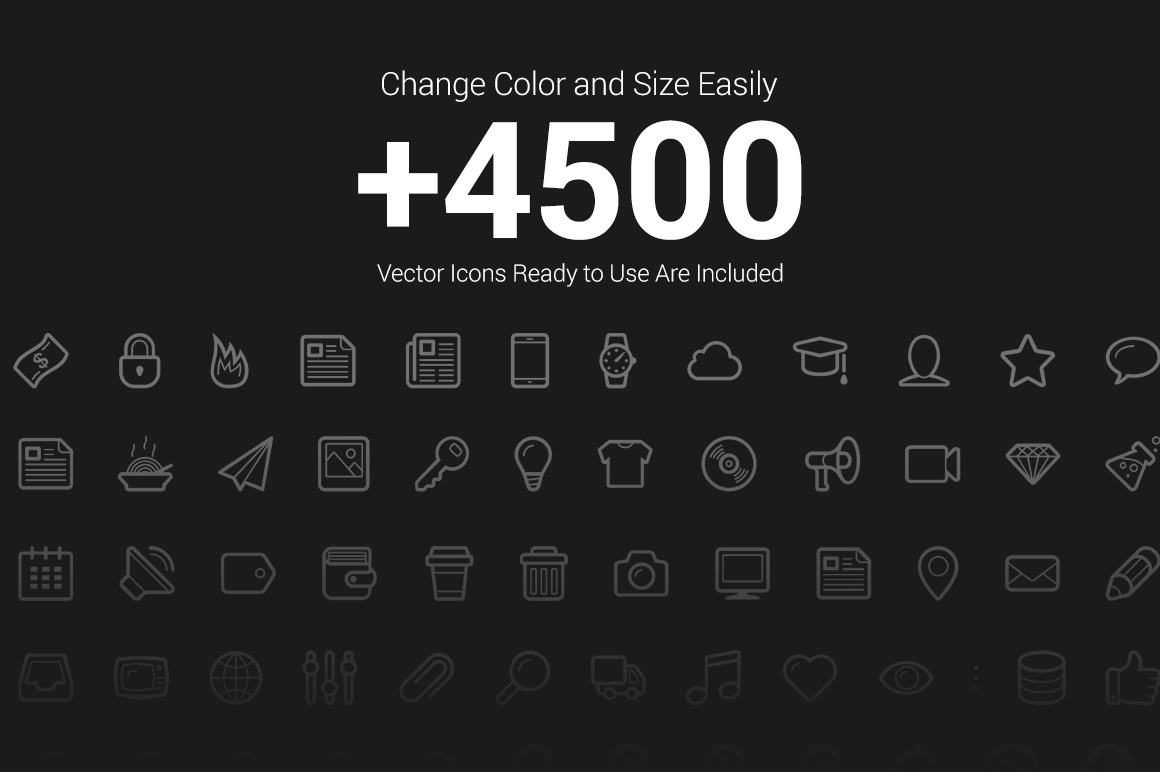
- 4500+ Icons! easily change size & color
- Data charts (Editable via Excel))
- Many layouts options
- Fully animated
Share Now!
Related Products


Same Contributor

Featured Products